Dashboard Overview
Note
This article relates to both the TM2 and TM3 versions of the desktop software.
The Dashboard within TM2/TM3 is a summary of the last 30 days activity within the system.
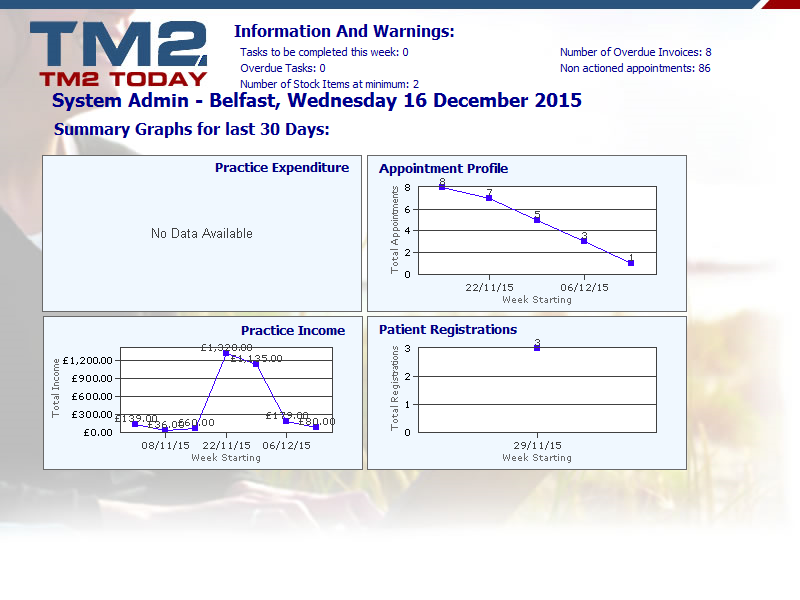
The Information and Warnings section is useful for monitoring stock levels, tasks, and invoices.
The Summary Graphs are weekly summaries. Each point on the graph represents a week.
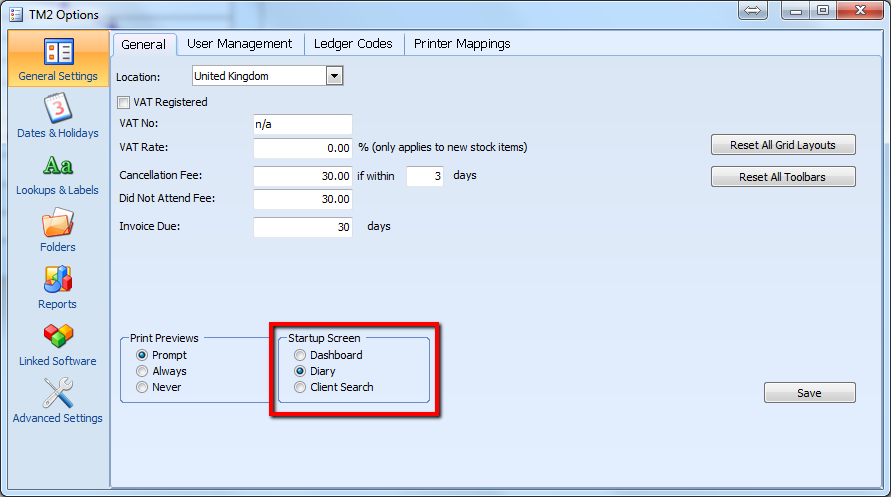
The Dashboard can be set to your default view by going to Tools > TM2 Options > General Settings > Startup Screen