2017 Bupa Reporting
Note
This report is still in Beta and may change as requirements adjust. To obtain a copy of the report please contact the Support Team. Your feedback will be appreciated, so if you find any stats missing just let us know.
In 2017 Bupa have introduced some new reporting requests which for the most part can be easily obtained by using the clinical notes sections of TM2 and TM3 Desktop. This version of the report is a replacement to the current Practice Group Activity Stats. Many aspects of the report do copy over to this updated version, the full notes of this report can be found below;
Group Invoicing and Reporting Changes.pdf
We have surmised the requirements down into the following areas;
- Average days between Admission & Discharge. This is broken down by body site.
- New to Follow Up ratio, again broken down by body site.
- Patient improvement measure (PROM), taken at admission and discharge.
- Wait times between Referral, Admission and First Appointment
- % of cases that have been audited
- % of clients that have completed a satisfaction survey
- Session averages by sub-specialty
- % of Consultant referrals
- % referred for onward referral to another clinical specialist
- % of members advised to self-manage after the initial session
Most of this information can be collected by standard use of the clinical areas in TM2 and TM3 Desktop. As a result of it's very likely that most of this data already exists and you do not need to implement any process changes.
Settings Required for the Report to work
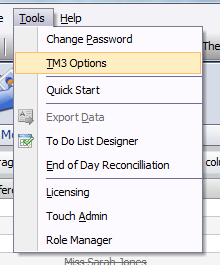
Within the Tools menu you will find TM2 / TM3 Options;
Once in the options select Advanced Settings
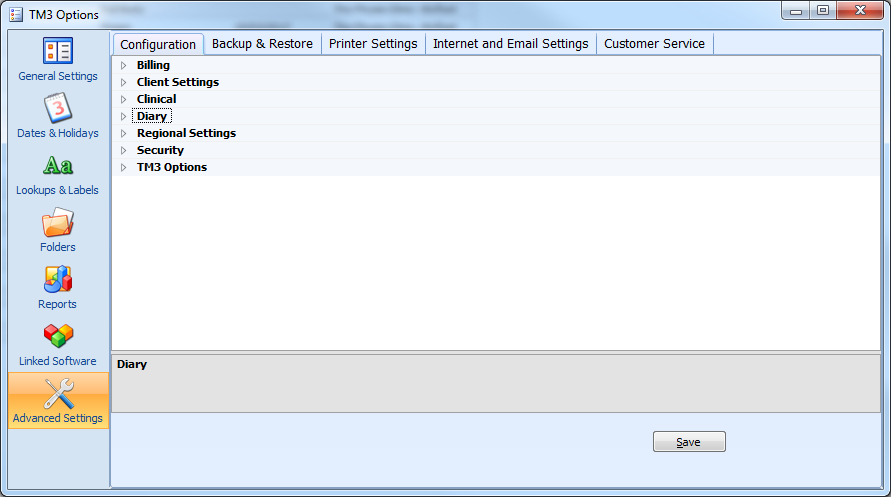
The settings that need to be adjusted are as follows;
Clinical
Enable Clinical Auditing of Cases - True
Diary
Link Appointments to cases on creation - True
How the report is populated
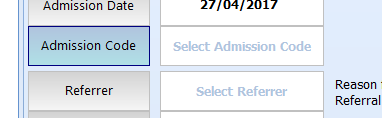
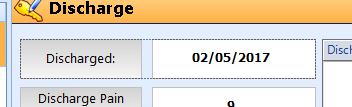
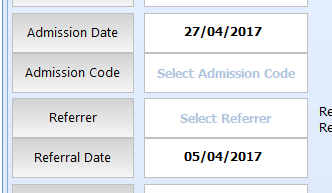
Average days between Admission & Discharge. As the name suggests this is simply an average of the days between the Admission and Discharge dates on their respective tabs within Touch notes.
New to Follow Up ratio, again broken down by body site. This information requires that your appointments are linked to a case and simply takes a total of these. The value shown is a decimal value of Initial to Follow Up. So, if the value is 2, it means you have an average of 2 follow ups per initial.
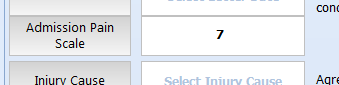
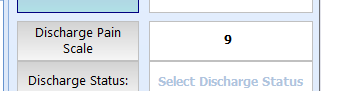
Patient improvement measure (PROM), taken at admission and discharge. This is calculated from the Admission & Discharge Pain Scale. It is a 0-9 scoring scale, (0 being no pain, 9 being the worst) the report will average these changes and allow an overall change to be recorded.
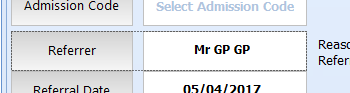
Wait times between Referral, Admission and First Appointment. Reading from the Admission tab of a Case and the first (Linked) Appointment.
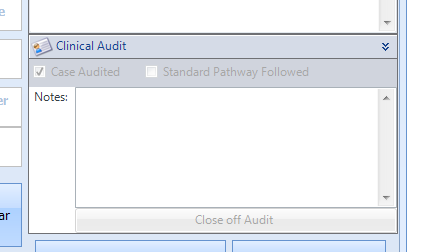
% of cases that have been audited. On the Discharge tab, there is an option to check Case Audited. If you cannot see this option you must enable Enable Clinical Auditing of Cases within the Advanced Settings (detailed above).
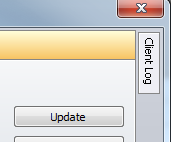
% of clients that have completed a satisfaction survey. This is recorded based on the Patient Log accessed from the Patient form.
Select this and create a new entry for Satisfaction Survey
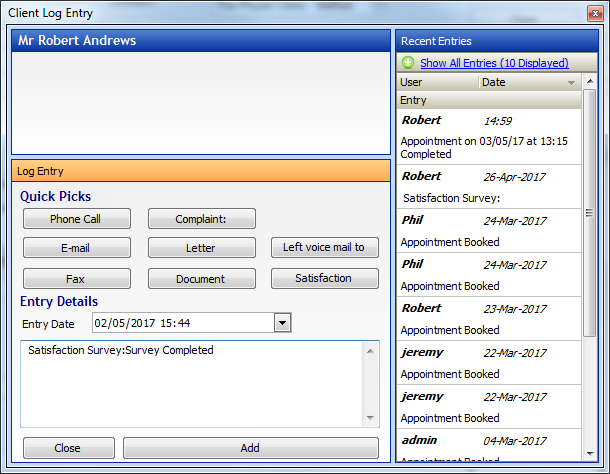
You can simply press the Satisfaction button to enter the correct information. The report expects the words "Satisfaction Survey" to appear within the text. You can add additional text to this if you wish. The date must also be between the Admission and Discharge of the Case.
Session averages by sub-speciality. A check against Bupa treatment descriptions listed below;
AA360 Initial Musculoskeletal Physiotherapy
AA361 Follow on Musculoskeletal Physiotherapy
AA350 Initial Vestibular Rehabilitation
AA351 Follow on Vestibular Rehabilitation
AA352 Initial Female Health Physiotherapy
AA353 Follow on Female Health Physiotherapy
AA354 Initial Neurology Physiotherapy
AA355 Follow on Neurology Physiotherapy
AA356 Initial Chest/Respiratory Physiotherapy
AA357 Follow on Chest/Respiratory Physiotherapy
AA358 Initial Hydrotherapy
AA359 Follow on Hydrotherapy
AA362 Initial Domiciliary
AA363 Follow on Domiciliary
The count is based on completed appointments between the date range.
% of Consultant referrals - Uses the Category of the assigned Referrer within the Admissions tab. You will need to have the correct category assigned to each contact to report accurately. For example, all of your consultant contacts will need to be set as consultants and so on. The report will allow you to see all types so you have a reference point.
% referred for onward referral to another clinical specialist. This section relies on the Practitioner Outcome field on the Discharge tab. You may need to amend or add new values to have the report produce meaningful data.
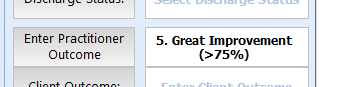
% of members advised to self-manage after the initial session can also be determined by use of a corresponding value for the outcome measure. The report also will show a summary of cases that have only had a single treatment. These clients could be assumed that a self management route was appropriate
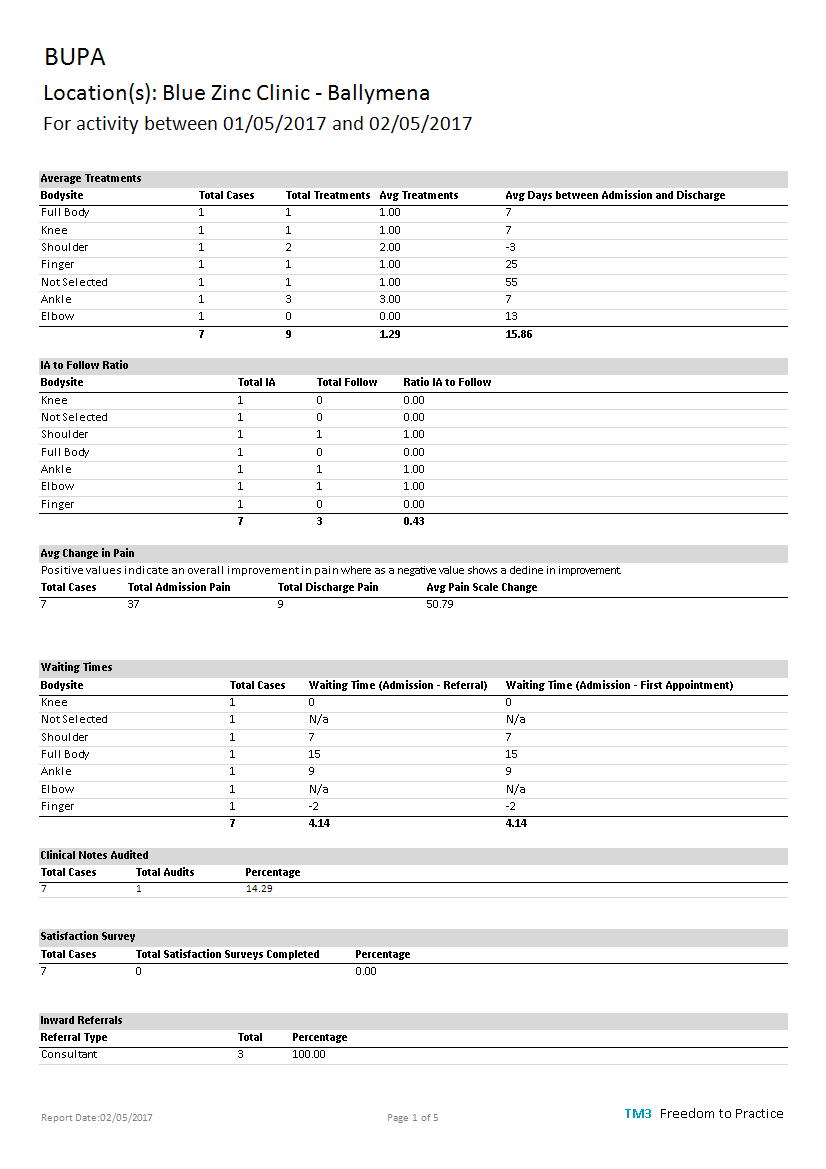
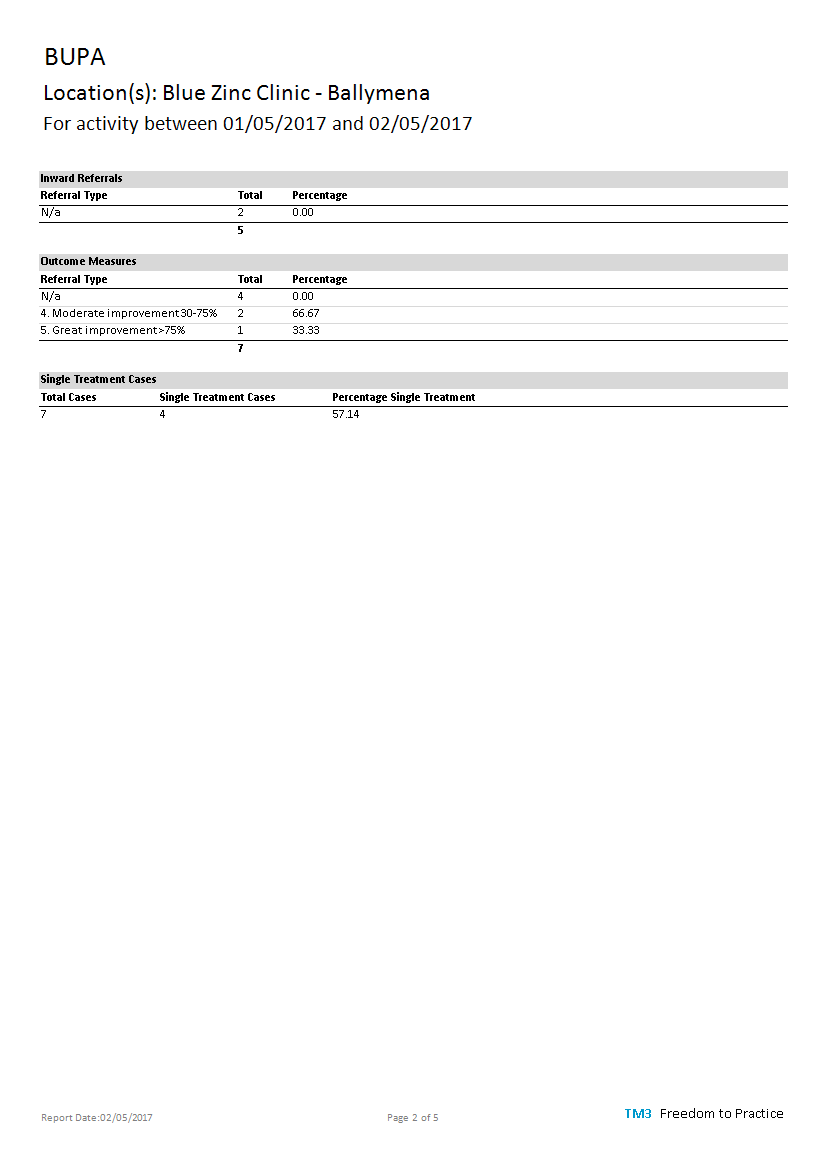
Sample Report